Mavic Wind Tunnel Challenge
Mavic Wind Tunnel Challenge
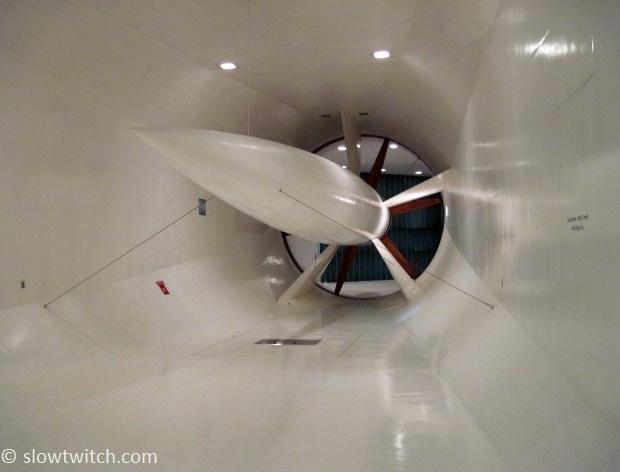
If the title of this article sounds bold, that’s because it is. At least I thought it was when the original concept was presented to me. French wheel manufacturer, Mavic, invited a handful of journalists to the San Diego Low Speed Wind Tunnel for an old West, Texas-style shootout. But rather than bringing guns and bullets, we were asked to bring bicycle wheels and tires. The challenge was this: Bring anything you want, and we bet our wheel and tire can beat it – the new CXR 80 wheel with elastic aero Blades. Low drag wins… winner takes all. While Clint Eastwood wouldn’t necessarily care for the specific subject matter, I think he’d admire the bravado (and perhaps give an approving eye squint).
This, of course, sparked many a question in my mind. Since this was a manufacturer-run and funded test, could it be rigged? Could they tune the tunnel testing protocol to favor their product? Why not just pay the wind tunnel a little extra for the effort… maybe that would tack on a few extra grams of drag to a particularly fast competitor. Going in to the event, I was prepared with a skeptical mind – and a lot of questions.
The second part of this article could be better described with a second title. Something to the effect of, “Thoughts on the Value of Testing Bicycles and Bicycle Parts in the Wind Tunnel.” This wind tunnel trip sparked many interesting conversations with several well reputed industry experts, which I’ll attempt to boil down to a more succinct take-home message.
The Test
To begin, we need to cover testing protocol. As history has shown us, much of a test’s results have to do with how the test is set up. Want to achieve a certain outcome? Design a test to get that outcome. We see statistics and numbers thrown around all the time. “Now with thirty percent more active ingredient than the leading competitor!” According to whom? Even worse are the claims that can’t even be measured by a standard unit in a real test (i.e. So you’re telling me that this will keep my brights brighter, my whites whiter… and it has the same great taste, just with a new eye-catching package?).
I considered it to be good news when I heard this test would happen at the San Diego tunnel. While there are certainly other good wind tunnels around, San Diego is the historical gold standard for cycling. We’ve all seen photos of champion cyclists and triathletes being tested here.
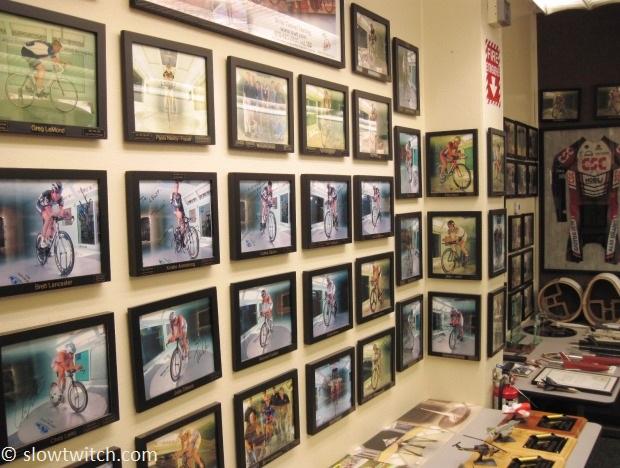
The same goes for manufacturers. It’s no secret that some of the top wheel, frame, and component manufacturers have used San Diego for many years. The good thing about having a lot of clients is you collect a lot of historical data. Over time, you establish baselines, and a specific standard protocol for future tests.
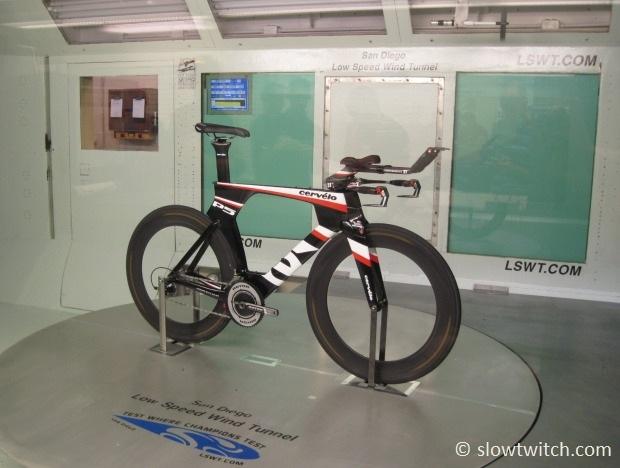
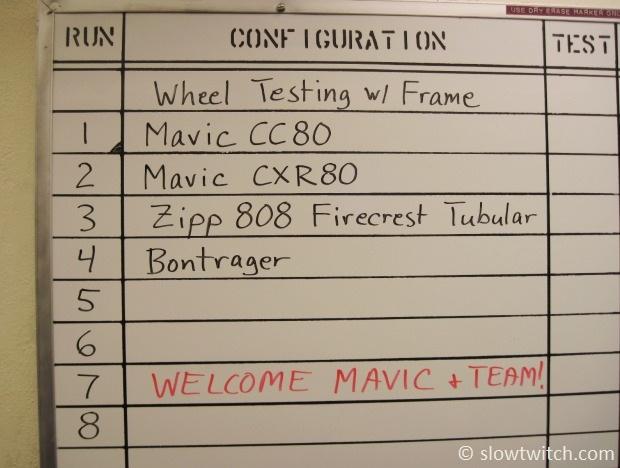
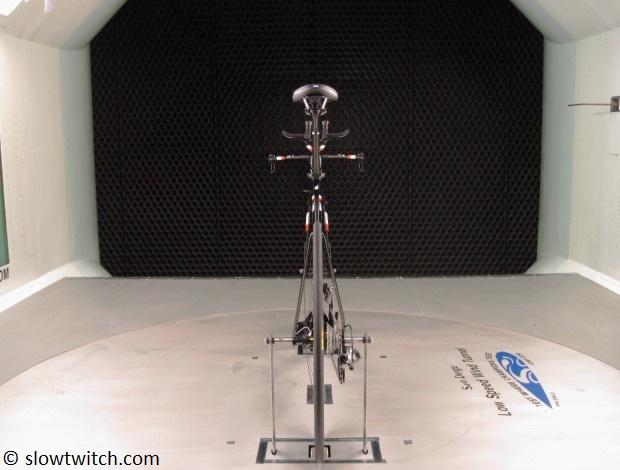
After speaking with both the Mavic staff and the wind tunnel staff, I was reassured to find out that they would be following what looked to be a rather middle-of-the-road protocol: Taking data points every 2.5 degrees of yaw, and from zero to twenty degrees. Measurement at each yaw angle happens over a run of approximately 45 seconds. The wheels were all placed in the same “control” frame – a Cervelo P5. Both wheels were spinning at a speed which was controlled for the entire test. The wheels would be installed by the highly-experienced wind tunnel staff – and not the Mavic staff – to eliminate potential tomfoolery.
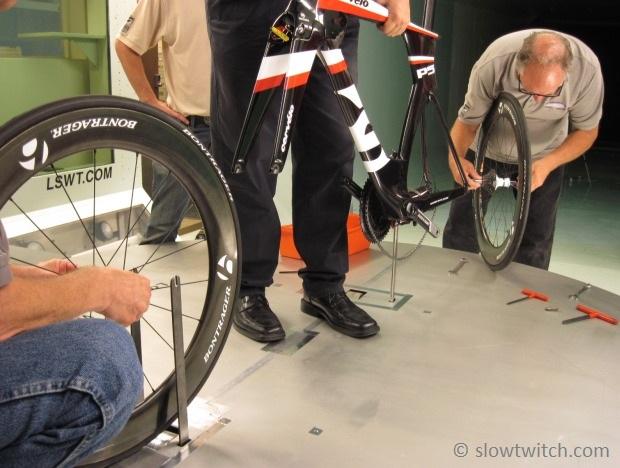
Runs would be done both to the left and right of the bike to account for drag differences between the drive side and non-drive side of the bike. We were able to watch the whole thing and ask as many questions as we desired. It looked to me like they made every effort to ensure as level a playing field as possible. In the words of the tunnel’s own engineering manager, Stephen Ryle:
“Yes, we do have a standard protocol for wheel testing in our facility and that was what we used for this particular test. Our general test procedures are standard and mostly the same from test to test, however we do vary it in some ways for each specific Customer based on their requirements. Probably the biggest thing that changes for each test is the range of angles (yaw angles) and specific angles within that range. That is driven by the Customer for the particular wheel, bike, etc. For the Mavic test, we tested at angles from -25 to +25 degrees at every 2.5 degrees. But we have also tested 0 to 15 at every 5 degrees, and every combination in between.
During each test (run), once the angle is changed and set to a new angle, we allow a time period for the wheel to “just sit there and spin” and the flow to stabilize around the wheel and any transients in the data caused from moving the wheel to settle out. This is usually about 20-30 seconds. Then we record data continuously over a period of about 15 seconds, during which we record lots of samples. Then we average all of these samples to derive a single steady-state data point for each yaw angle. Then we move the wheel to the next yaw angle in the schedule and repeat this process. All told we usually spend 40 to 50 seconds at each yaw angle.”
In the past, a lot of frame and wheel testing was done up to thirty degrees of yaw. From speaking with several frame and wheel manufacturers, my sense is that this is slowly shrinking. Why is that? The consensus that I’m hearing is that most wheels and frames will reach the point of air stall well before you reach thirty. Similar to airplanes, you want airflow to stay attached to the surface of the wheel. When air stays attached and laminar, drag is lower. When the air stalls, you get a slower wheel or an airplane that falls out of the sky. Another part of this testing range consideration is simply the question of what yaw angles you’ll realistically see on the road. I’ve had different wheel companies tell me independently that achieving thirty degrees of yaw requires a really, really windy day… combined with a really, really slow rider. My armchair guess is that when it is that gusty out and you’re riding that slow, your wheel choice probably isn’t going to matter much in terms of your racing success.
The Contestants
We’ve established the protocol, so it’s time to learn about the competition.
In the red corner, weighing in at a collective twelve thousand, one hundred and eleven grams… from all over the globe… the defending champions of the aerodynamic title of the woooooooorld……!
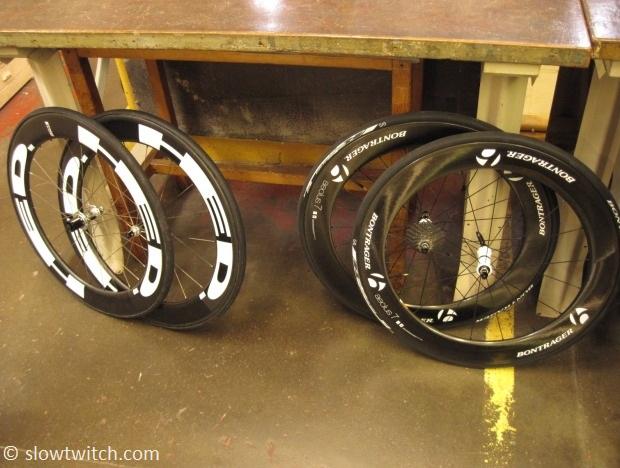
1. Mavic Cosmic Carbone 80 (2012 model) front + rear with Mavic Griplink/Powerlink 23mm tubular tires
2. Zipp 808 Firecrest tubular front + rear, with Vittoria Corsa EVO CX 23mm tubular tires
3. Bontrager Aeolus 7 D3 clincher front + rear with 22mm Bontrager R4 clincher tires
4. HED Stinger 7 (new wide design) front + rear with Vittoria Corsa EVO CX 23mm tubular tires
5. HED Jet 90 (narrower rim from ~4-5 years ago) front with Conti Supersonic 20mm clincher tire; used with Zipp 808 Firecrest tubular from above on the rear of the bike
…and in the blue corner, weighing in at two thousand one hundred seventy grams… from deep in the heart of France… the new kid on the block, with a mean face and eager to race…
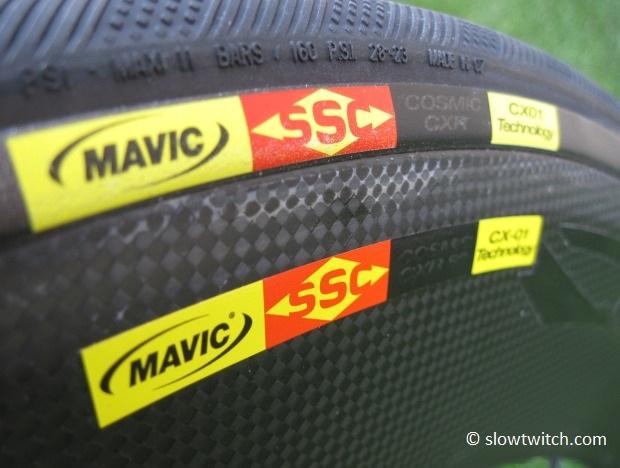
6. 2013 Mavic CXR 80 front + rear tubular with new CX01 Griplink and Powerlink 23mm tires and Blades
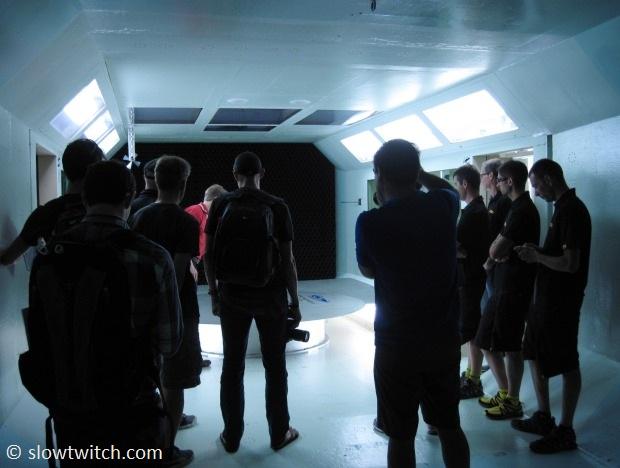
The testing ensued. While I’d love to say it was exciting and action packed, it was actually pretty boring. It takes a long time, and you really just watch a riderless bike sit there and spin its wheels. All the while, a bunch of bike industry dorks sit in the control room drinking coffee and discussing the nuances of tire compounds.
After a whole morning of test runs, we wanted to see the knockout punch. Who was the winner? Did Mavic rule their own challenge?
While it was a close fight, there did emerge a winner: The Mavic CXR 80. The new kid had all the right skills, and showed some established players who’s the boss.
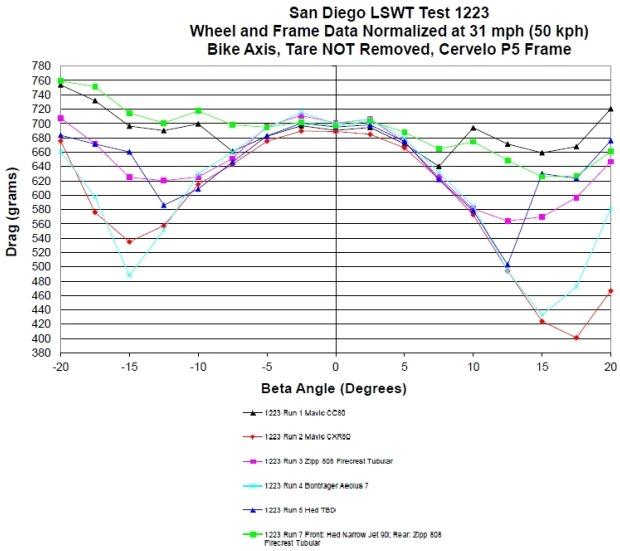
Black line: Mavic Cosmic Carbone 80
Red line: Mavic Cosmic CXR80
Pink line: Zipp 808 FC
Light blue: Bontrager
Dark blue: Hed Stinger 7
Green line: Hed Jet/Zipp combo
As you can see, it was a close battle, especially from zero to ten degrees. At zero, everything looks about the same. At ten, the delta between the fastest and slowest wheel is about 100 grams of drag.
At higher yaw, the real differences begin to show up. On the right side of the graph, the Bontrager (light blue) and Mavic (red) are nearly dead-even up to fifteen degrees, where the Mavic finally pulls away. On the left side of the graph, the Bontrager is actually the fastest between about 13 and 17 degrees. Why the big difference in left and right sides of the graph? That is simply the difference between the drive and non-drive side of the bike. It is important to test both left and right sides even if you test sans bike – some rear disc wheels are asymmetrical, and you can even have small variances in things like tire casing and how straight they’re glued on.
Take-Aways
What can we take away from this test? I think there are a few things of significance. First, we should give credit where credit is due. Next, we can clearly see that there is more than one fast choice out there. The thing we don’t have on this graph is an old school box-section aluminum wheel with 36 straight gauge spokes. That would give us some much-needed perspective – essentially, a way to mentally zoom out on the graph. Real-world performance shows us that races can be won on any of the wheels we tested. Heck, you even have extremes such as Bella Bayliss, who has a history of riding standard aluminum wheels with thick training tires to Ironman victories – simply because she is among those who dislike dealing with flat tires and valve extenders.
You can have tubular, clincher, or carbon clincher. You can really get away with a variety of tire sizes and still perform well. Even a few years ago, nobody would have guessed that an aero wheel test winner would be shod in 23mm wide tires. In terms of price point, the cost of entry into fast wheels really isn’t out-of-this world – the Hed Jet is a very worthy competitor and costs half of many other wheels (and keep in mind that the one in our particular test is the older narrow model; the newer wide models are more aerodynamic). Frames are getting more clearance to accommodate these new wheels, and you have about every flavor of tire choice and Crr imaginable. My personal view is that the aero playing field is leveling out quickly. Perhaps the current standards are maturing, and it will take a big paradigm shift to see the next big step in aero performance.
Of course, this was not a perfect test. I can sense the geeks just waiting to shoot it full of holes or question the methods. Wouldn’t some of the competitors have been faster with 21mm tires? What about testing wheels only – without a bike? What about testing with a rider? The data isn’t valid because the tare from the wind tunnel pylons hasn’t been removed from the graph. You should have tested more wheels. You should have tested more tires. Woulda-shoulda-coulda.
Lucky for me, it’s not in my job description to answer the nit-picks. I’m a writer (granted a geeky one), and not an aeronautical engineer or a Mavic employee. While the test was not perfect, I commend Mavic for rolling the dice and doing it. Mavic Communications Manager, Zack Vestal, told me later that day that he was quite nervous before the testing began (and it was spoken with a half-hidden sigh of relief). I say: Let the data stand where it stands. Let’s learn what we can from it, and encourage this type of transparency more in the future.
Interesting Notes
The San Diego tunnel is 12 feet wide, 8 feet tall, and can test up to 270 miles per hour.
The Mavic CX01 Blades are not UCI legal, but are 100% triathlon legal.
According to Mavic, the Blades are the “cherry on top”, and add about 5% to the overall aerodynamics of the wheel + tire system. Without them, they say the wheel is still quite fast, and faster than their Cosmic Carbone 80. The Comete disc is still their fastest wheel (by their own data – the disc was not tested during out time in San Diego).
The “22mm” Bontrager R4 clincher tire measured slightly wider than the “23mm” Mavic Griplink/Powerlink CX01 tubular tires.
Wind tunnel time in San Diego will run you about $1,000 US per hour.
No word yet on rolling resistance of the new CX01 Griplink/Powerlink tires.
Worth of the Wind Tunnel
As promised, I’d like to boil down some interesting conversations with a handful of industry experts before, during, and after this test. I’m no stranger to the wind tunnel and what it has to offer. It is largely agreed to be the most accurate and repeatable way to measure aerodynamic drag of bicycle parts. Field testing also has value, but regardless of its accuracy, it will never be as marketable or “believable” as the wind tunnel, at least to the layman. We want to see something official. We want lab coats, data, and flashy photography.
The view from the other side:
Indeed, wind tunnel testing is very cool. And I agree that it is our best way of attempting to clear the muddy waters – so we can actually compare two different things and arrive at a meaningful conclusion.
However, in my conversations with several industry experts, a common theme kept coming up. In essence, something isn’t adding up. One plus one equals three. What do I mean? If we took the measured drag of the bike frame, plus the helmet, plus the wheels and tires, plus the jersey… and “small” details like a pedaling rider, gel packets, ambient wind, and on and on… the numbers don’t add up. The total is more than the sum of the parts. Expert bike fitter, coach, and performance consultant, Mat Steinmetz, has had similar experience in his many trips to the tunnel. “If you took the time savings from the TT helmet and the new frame, and wheels, and all of this stuff, we’d have guys riding an Ironman bike split in three and a half hours… and that just doesn’t happen.” But he was also very quick to say that this doesn’t necessarily devalue the tunnel, or that we should stop testing and trying to improve – just that we ought to take what it tells us with a grain of salt.
One of my favorite tests to reference was done by perhaps the perfect subject – an independent bike shop. Several years ago, Gear West Bike and Triathlon funded their own test at MIT. They aren’t your average mom-and-pop bike shop – they have a very high-level elite team, a very fast-racing owner Kevin O’Connor, and even see some part time work from professional triathlete and nuclear engineer, David Thompson. If you ever have the chance to meet this gang, I hope they also come off as genuinely nice people who are dedicated to the sport in many ways. More specifically, they decided it was a good idea to pay for their own wind tunnel time – for no other reason than to satisfy their own curiosity. Why believe the marketing hype from their sales reps when they could test for themselves? You may question whether this was a wise expenditure in terms of ROI, but you cannot question the well-intended enthusiasm.
The test was done over a weekend at the MIT tunnel. While not as sophisticated as San Diego, it is still a legitimate testing ground that produces accurate data. Tests were done at zero, seven, and fifteen degrees of yaw. Samples were taken in a similar fashion to San Diego – about a minute per yaw angle. The tough part about the MIT tunnel is the fact that the yaw doesn’t change on-the-fly; you have to go back in the tunnel, adjust everything, go back out, start everything back up, and test again.
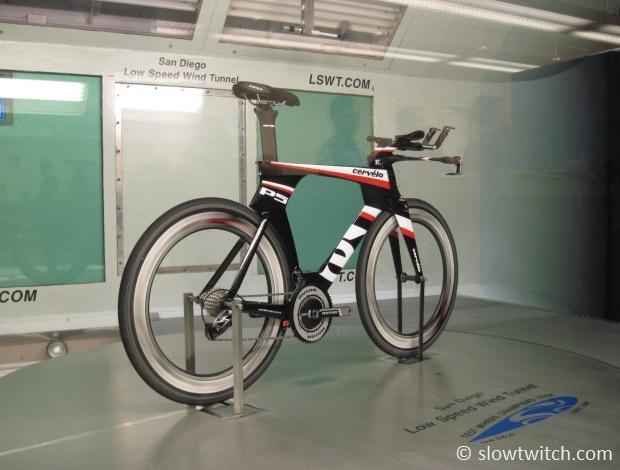
The San Diego tunnel has a turntable that adjusts yaw on-the-fly:
After an entire weekend of testing, I wondered what the key take-homes were. According to David, they found that the big hitters were position, clothing, helmets, wheels, and to a lesser extent, hydration systems. He said, “One of the easiest things you can do is just wear tight clothing. On position, our results were similar to what we hear elsewhere – lower and narrower tend to be faster for most people… but if it’s so low you can’t hold the position for the whole race, it isn’t worth it. We found that adding race wheels showed a measurable improvement, as did most aero helmets. However, the helmets’ effectiveness was really dependent on the person.”
Given the volume of things they were trying to test, it obviously wasn’t comprehensive of everything on the market. What I do like to point out is their extreme attention to detail and repeatability. If they were testing one variable – they tested just that one variable. Everything else was consistent – rider, clothing, helmet, position, hydration, and so on. Take one of their frame tests, for example. It was done with test subject and shop owner, Kevin O’Conner. He had two personal bikes set up identically – same bars, saddle, position, components, wheels, tires – everything. The goal was just to get an idea of the aero difference between two fairly different frames.
Test subject A was what we’ll call a “semi-aero” titanium frame with slightly ovalized tubing, but nothing extreme. Test subject B was a then-cutting edge carbon aero frame. Sans rider, the frames showed a fairly significant difference in drag (the carbon frame would cut about 50-60 seconds per 40k at 25mph). However, when a pedaling rider (Kevin) was placed on each bike, there was no measurable difference in the two frames. Zero, zilch, nada.
Keep in mind that I’m not suggesting a slippery slope here – i.e. there isn’t a single frame that will make a difference for any rider. This was a one test of a single rider at a couple yaw angles. Perhaps there was a small difference, it may have just been smaller than the test’s margin of error. My intent is to give an interesting example as food for thought – a single data point for you to add to multitudes of other sources. The reason I wanted to mention it is simply because it’s something different than we’re used to reading. We all want to see data that is impressive and exciting. Even in the world of scientific journals, everyone wants to see results of significance. It doesn’t do anything for us when the test’s result is, “Well, sorry… but nothing really happened.”
Perhaps I’m just stubborn, but I tend to keep asking questions until I get what really sounds like an honest and candid response. We all love going fast, and seeking to get faster. That’s a huge part of the fun of triathlon – the process. Eventually, nearly every engineer or equipment expert I speak with (sometimes sheepishly) concedes that – in fact, it is the training that matters most. The training, and what’s going on in your head. For some, having equipment that is light weight or low drag helps to reinforce what’s in their head. You go in to the race knowing that you’ve done everything possible, including buying the best equipment. And that’s great if it floats your boat. If, however, you are new to the sport or don’t have the cash to buy the latest and greatest, I think it’s important to keep in mind that one can be very successful with only the basics.
It doesn’t matter which side of the fence you fall on. I’ll argue that regardless of any of it – you can’t deny that we live in a very exciting time in the triathlon world.


Start the discussion at slowtwitch.northend.network