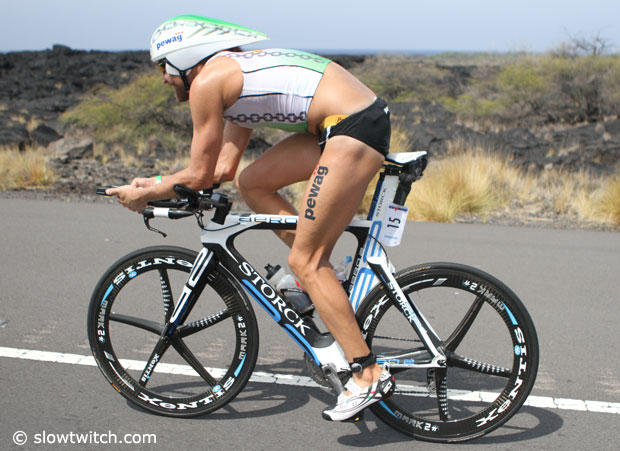
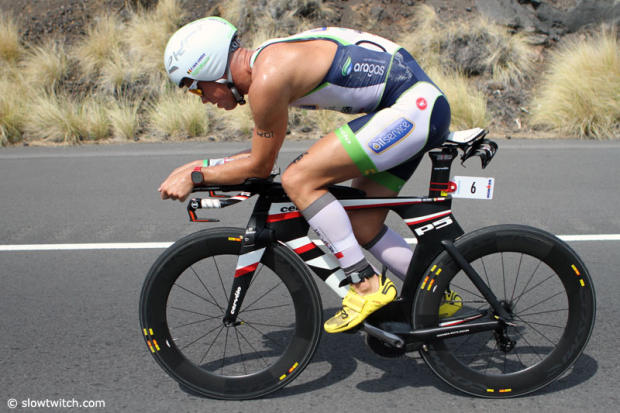
Kessler vs Corbin – power
Meredith Kessler and Linsey Corbin both finished in the top 10 at the 2013 Ironman World Championships and here is an analysis of their power data files thanks to TrainingPeaks and their analyst Jim Vance.
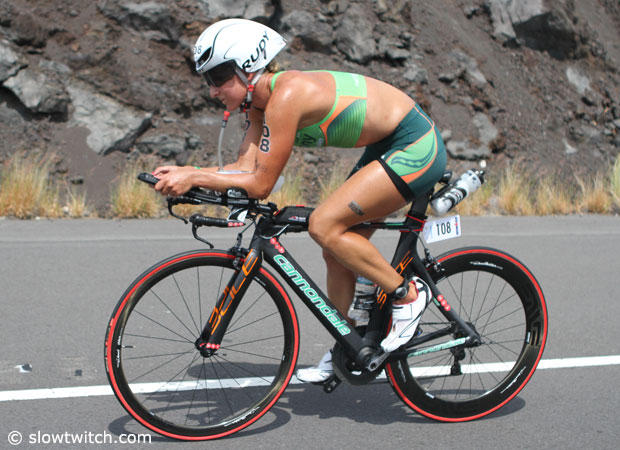
The professional women’s race at the 2013 Ironman World Championships was very exciting, as many of the top contenders exited the water together at the front, battling hard to try and hold off Mirinda Carfrae and others. Though we don’t have Carfrae’s power data, we do have that of American Meredith Kessler, who had an exciting sprint finish to place 7th, and her PurplePatch Fitness teammate Linsey Corbin who finished 10th.
Kessler's CycleOps power data on TrainingPeaks can be found here and Linsey Corbin's Quarq power data on TrainingsPeak here.
Kessler and Corbin rode different races due to the fact that Kessler was at the front from the start, coming 5th out of the water, while Corbin had to work hard to try and catch the leaders.
There has been quite a big debate about the effect of being at the front of the bike pack – whether there is a drafting benefit the riders receive even when racing at a legal distance, or the mental benefit of having many others around to keep the pace high. Though there are a lot of variables at play in this debate, the first numbers to catch your eye might be the Intensity Factors (IF), as Kessler and Corbin both rode an astounding .80 IF, meaning they basically rode for nearly 5 hours at 80% of their functional threshold power (FTP)!
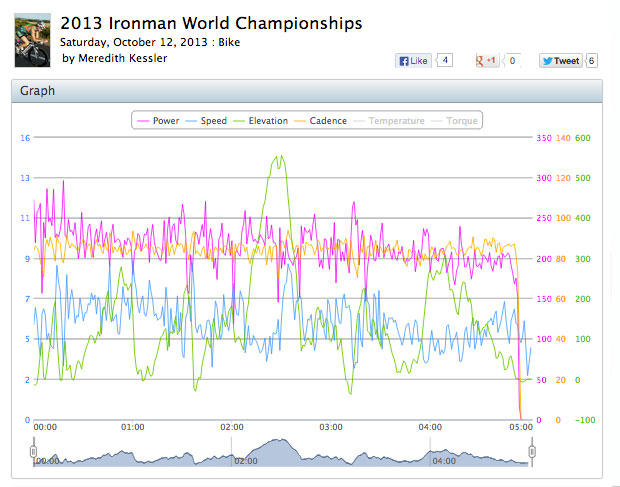
The Training Stress Scores (TSS) for both these ladies were extremely high (314 TSS for Kessler and 330 TSS for Corbin), and might even suggest their FTP’s are actually higher than reported. 100 TSS denotes a one-hour, all-out effort at FTP and most Ironman athletes don’t tend to run well when going over 300 TSS for a bike effort. (For reference, Luke McKenzie’s ride was only 293 TSS.) Kessler told TrainingPeaks her FTP is 275 and Corbin reported in at 260, but the TSS scores show they might be a tad higher than this. Of course, they could be correct, and the girls just ran very impressively, despite the effort and output on the bike.
Another interesting number is the Variability Index (VI), which represents the variability of the intensities throughout the race. In a post-race interview with Quarq and TrainingPeaks, Corbin said that even though she came out of the water with Carfrae, she felt the need to ride her own race and avoid the big spikes throughout the day. Her 1.03 VI means she only varied about 3% of her effort from the start to the finish, showing she executed exactly that plan. Meredith saw the same variance with a 1.03 VI. This is still quite low, but it was likely harder to maintain a lower VI when she was dealing with the shuffling and surges that come with having many other riders around you in the front. You can also see this in the Peak Power outputs for durations less than 30 seconds, as they are about 10% higher on average for Meredith than Linsey, but for longer than 30 seconds their values are much closer.
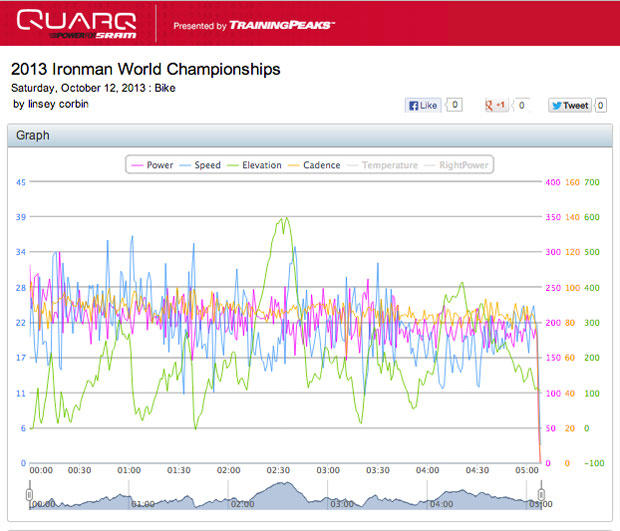
It should be noted that the speed sensor in Kessler’s device appears to have recorded erroneously, as the race was clearly longer than 26 miles on the bike. However, this error only affected speed and distance, without effect on power data.
The climb to Hawi was a hard effort for both athletes, and their numbers were quite similar for VI, IF and cadence for this section. However Kessler was able to put nearly 30 seconds into Corbin on the 10km climb, due to her putting out a watt per kilogram (w/kg) average of 3.9 versus Corbin’s 3.8 w/kg. The difference translates to 8 watts on average (4% higher than Corbin’s actual output up to Hawi) or 3 pounds of body weight lighter (not likely due to her small size to begin with).
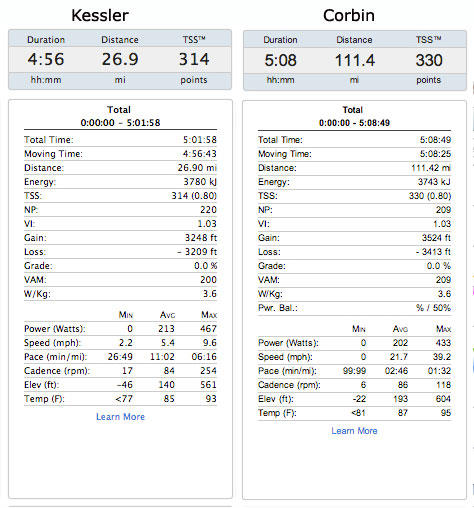
In the end, w/kg value was the same for both girls, but Meredith’s Normalized Power, (NP), was 11 watts higher, 220 to 209. Given the fact their w/kg were the same, and their NP’s only about 5% different, it is unclear if the aerodynamics of Meredith were better, or if the pack helped her to keep the speed high, gaining a drafting benefit even from racing at a legal distance. Corbin brought back almost 12 minutes on Kessler later on the run while Kessler faded from a starting lead to 7th place. Perhaps this means if Kessler were able to avoid the surges, she might have been able to run faster, but there are too many variables to determine that for sure. In the end, she still finished higher than Corbin. Many might claim aerodynamics and the coefficient of drag, (CdA), are really the factors at play here. However, there are too many variables with that, as the wind pushed from different directions throughout the race, riders don’t have equal advantage or disadvantage given the same yaw angle of the wind, and even timing in the same point on the course can mean different wind conditions.
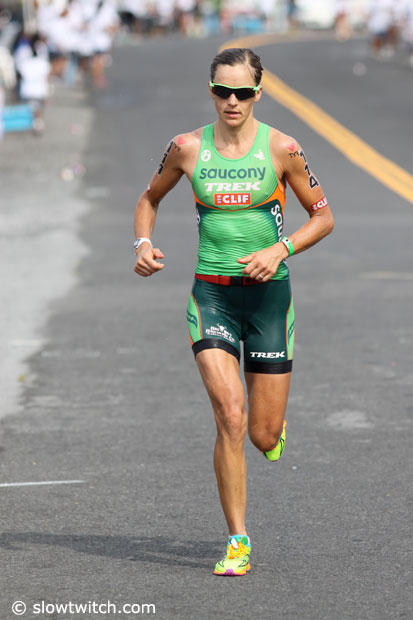
The debate over the importance of position out of the water and how hard an athlete should ride, whether with the leaders or alone playing catch-up, will continue on. But from these files we can see how two different strategies look by the numbers, and how well both athletes still executed their race plans throughout the day to come in for top ten spots.
The analysis has been updated and revised from the version posted 10/16 due to reader comments and revised calculations.


